DEAR READER,
I hope you will enjoy THE QUARTERLY COMPASS Q4 2023!
In the current edition, you will find:
- A New Years video message from Chris
- Investment results for all our investment strategies for the calendar year 2023
- Minor changes to our long-term thinking - for your convenience all changes are written in bold blue text.
Wishing you a great 2024!
Alex Vozian, CFA
Co-Founder and Associate Portfolio Manager
Aspira Wealth.
-----------
THE QUARTERLY COMPASS - ASPIRA WEALTH – DECEMBER 31, 2023
Summary: Stock markets ended the calendar year on a strong note, resonating with optimistic views that we shared repeatedly in our publications. We maintain our long-term optimistic bias, while looking forward to some volatility in the short term.
INVESTMENT PERFORMANCE
Most of our in-house investment strategies ended the years of 2021 and 2022 with significantly better results than the market averages.
For 2023, we had another good result in our core investment strategy - The Dividend Value Discipline™ - that witnessed a +18.8% gain in equity-only version and + 14.7% gain in balanced version. Both numbers are better than market averages.
The rest of the strategies had a lower gain in 2023, or even gave up some of the gains from previous years. This happened due to exposure to more volatile sectors (like in KMI / NCRF) and/or sectors with secular headwinds (like in FICC).
The three-year average gain in our largest three strategies is over 10.5%.
While these results are attractive, we place no weight on short-term results, good or bad, and neither should you. In fact, we occasionally make decisions that negatively impact short-term performance if we think we can improve our long-term returns and/or lower risk level.

Source: Aspira Wealth. *These numbers are relevant only for accounts with Raymond James Ltd. (Canada).
BROAD MARKET OBSERVATIONS
CANADIAN STOCK MARKET
- The Canadian stock market recovered all the losses from the past ~2 years and is now trading near the high of Q1 2022
- The recent strength reflects the expectation that the fight with inflation is over, (thus Bank of Canada will start cutting interest rates 2024), as well as the typical market strength near year end.
- The likelihood of a 5-10% decline in the market has increased since our last update (due to above average level of optimism of market participants). We intend to be more selective with buying during the next 3-6 months while maintaining our long-term positive bias. If market does contract 10% later this year, we will in all likelihood:
- Encourage clients to seize the opportunity of buying more at cheaper prices.
- Discourage clients from selling their investments in panic.
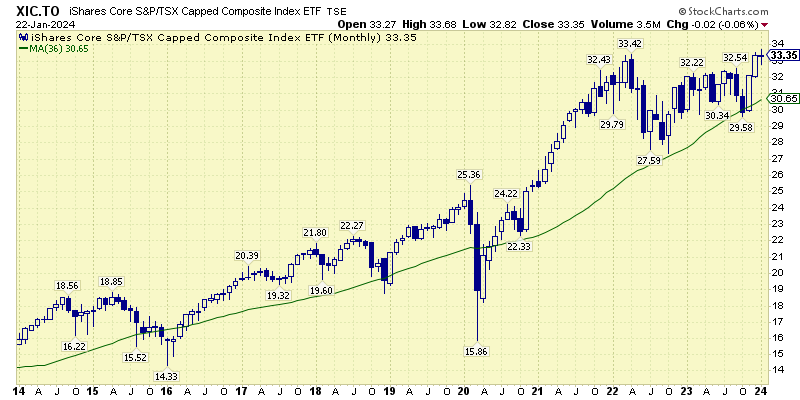
Chart courtesy of StockCharts.com
U.S. STOCK MARKET
- After a dismal 2022, the U.S. market ended 2023 on a very strong note, too.
- Most of what we mentioned above for Canada also applies to the U.S.
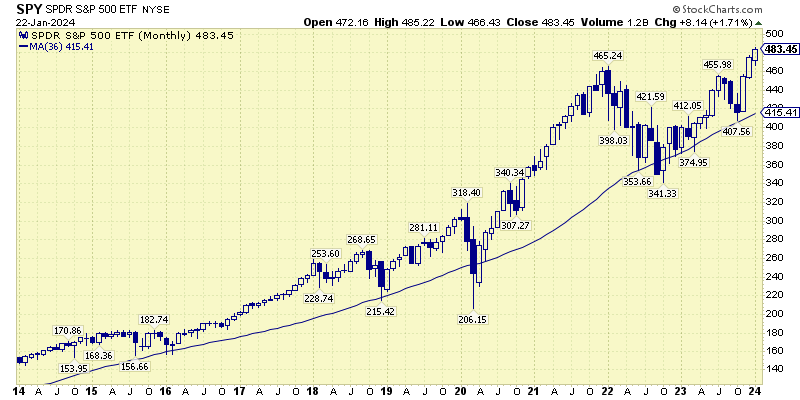
Chart courtesy of StockCharts.com
USD CAD Exchange Rate
- Over the past 30 years, the Canadian/U.S. dollar exchange rate was quite volatile, but it spent half of the time within the 1.20-1.50 CAD/USD range, including the last 8+ years.
- We assume that, over the long run, the exchange rate between CAD and USD will remain range bound, having a neutral effect for Canadian investors with exposure to stocks listed in the U.S., and for the U.S. Investors with exposure to Canadian stocks. Our assumption is based on the depth of economic connection between Canada and the U.S., as well as economic policy similarities.
- We will continue to allocate 50-75 percent of exposure to U.S. stocks, to not be limited by the rather undiversified Canadian stock market.

Chart courtesy of StockCharts.com
Dr. Copper
- Copper price is assumed to predict turning points in the global economy, since it is widely used in most economic sectors.
- Copper price was very volatile during 2022, and less so during 2023.
- Current price level of copper isn’t sending a clear positive or negative signal, while we continue to believe that long term fundamentals are super strong for copper.
- We expect copper prices to exceed $5 level during the next 3 years, as discoveries of new copper deposits are limited (i.e., anaemic supply growth) while the world needs a lot of copper to build and to power electrical vehicles (i.e., solid demand growth).
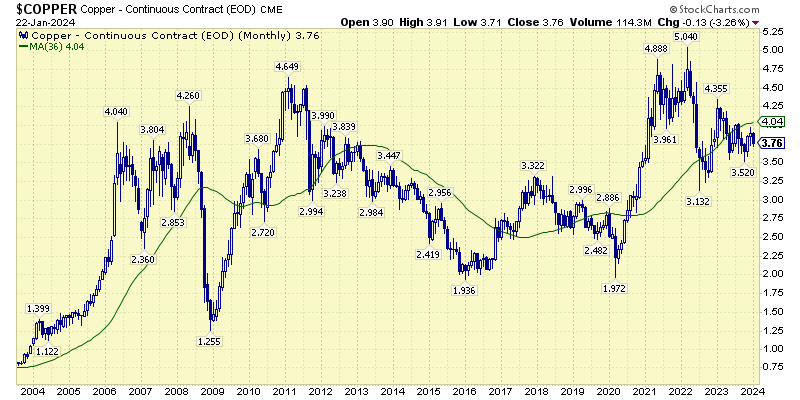
Chart courtesy of StockCharts.com
Dr. Semiconductor
- Semiconductors, a more modern version of Dr. Copper, are reflecting what is happening in the most advanced parts of the economy.
- Semiconductor stocks did really well lately, as seen in the chart below. Some volatility is to be expected in 2024 after the solid gains in 2023.
- The recent strength is driven by the AI race, push for semiconductor independence, self-driving car technology/infrastructure, investments in industrial automation, etc.
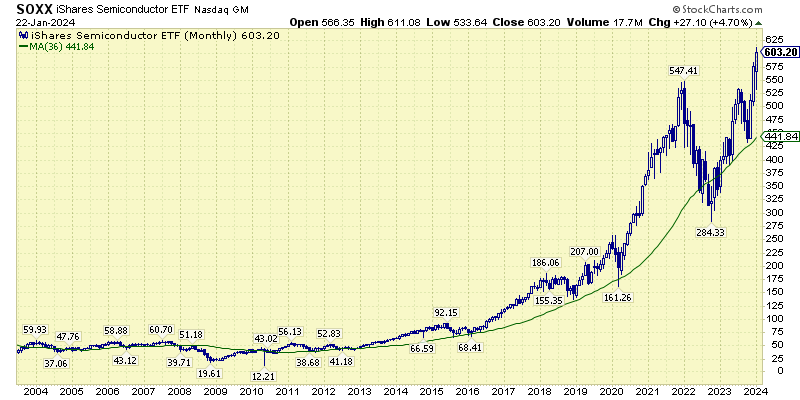
Chart courtesy of StockCharts.com
Energy
- U.S. oil price (WTI) lost all the gains of Q3 2023 during Q4 2023, due to slowing global economy.
- We continue to expect U.S. oil price (WTI) to remain volatile but stay in the wide range of $60-100 per barrel.
- We think it is unlikely to go below $60 during the next 3-6 years, considering the relatively low investments in production capacity in the past 10 years.
- We don’t expect it to go above $100, given the continuous efforts to transition to cleaner energy, although Chris notes that the demand for oil continues to grow far faster than most pundits expect.
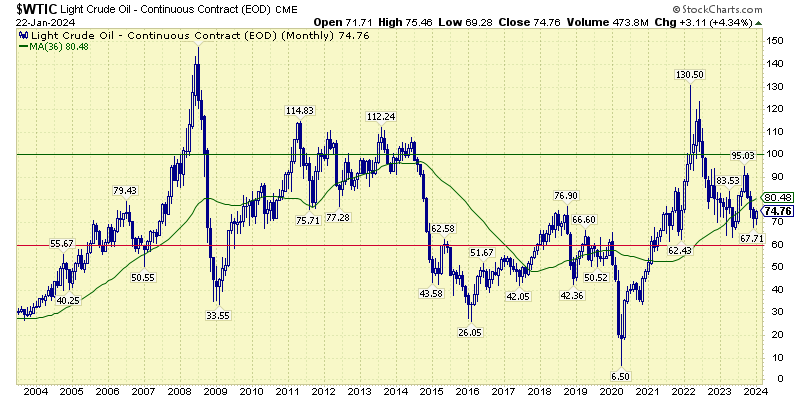
Chart courtesy of StockCharts.com
U.S. natural gas
- The price of natural gas was also volatile since our last update, due to the slowing economy and warmer than expected weather.
- We expect it to stay in a wide range of $2-5 per MCF (the gas prices are oscillating more than oil prices, due to exposure to the weather / heating season). Given the North American growing export capacity, we are biased to the upside.
- We do not expect it to go lower than $2 since the world is transitioning from coal / oil consumption towards natural gas and other cleaner alternatives.

Chart courtesy of StockCharts.com
WORRY JOURNAL - TOP WORRIES OF MARKET PARTICIPANTS AND BUSINESS LEADERS IN 2023-2024
- Inflation (in the news in 2021-2023) - inflicted by unprecedented government aid, relief, and economic security payments to individuals and corporations, relative to the number of products and services that the pandemic-constrained economy was able to provide. We expect inflation to continue to decline, as supply chains are recovering from a once-in-a-lifetime shock (pandemic), supported by the tight monetary policy (central banks increasing interest rates).
- Economic slowdown/recession (in the news 2022-2023) - on assumption that central banks will not be able to quickly fix the inflation problem and/or might increase the interest rates too much. We assume that central banks are near the end of the monetary tightening cycle. Even if they tightened too much, it might not matter in the long term. Higher interest rates and headlines about possible recession led to a slowdown in consumer and business spending (especially discretionary spending), but it seems that the economy is quite resilient. While interest rates are now the highest they have been in 10 years, they are still lower than levels seen in the previous 30 years. Trying to predict the timing of recessions typically doesn’t end well for most investors, so we chose to focus on the longer term. Even if a recession starts tomorrow, we think the downside is limited in the equity market, as typically the bottom of the stock market is usually 6-12 months before the official end of a recession. Equity market is a forward-looking animal, i.e., reflecting the near-term future expectations as opposed to where the economy currently is.
- Debt ceiling debate/potential of a U.S. default (2023) - a recurring worry in the U.S., where the negotiations often extend into the eleventh hour before an agreement is reached. The crisis was temporarily fixed in June 2023, i.e., discussions delayed to early 2025.
- War in Ukraine (2022-2023) - has taken a terrible human toll and seems to have no end in sight. While it is painful for people from the region and from around the world, we see that world trade and economy are gradually adapting to it, as it did in previous wars. Europe’s economy continues to grow, and the regional energy crisis seems to have been avoided.
- Supply chain disruption (2020-2023) caused by the pandemic. There are pockets of concerns related to supply chains (originating from the pandemic and/or recent escalation of U.S.-China trade war), but we think that the current shape of supply chains is significantly better than it was a couple of years ago.
- Labour shortages, attracting and retaining talent (2020-2023). The recent pandemic induced a major shock to the labour market. We believe the labour shortage is gradually getting resolved – hiring in the technology sector is now more rational, borders are being reopened to immigration, people are more willing and able to re-enter the labour force compared to a couple of years ago. On top of this, automation and AI are likely to continue to boost productivity.
- 2023 Israel–Hamas war (started Oct 2023) – is another unfortunate and tragic event on the global scene – tens of thousands of people were killed, and millions were displaced in the past three months. We assume and hope that conflict will moderate or end in the near term. While it is painful for people from the region and from around the world, the global economy is used to major conflicts like this, so we don’t see it as a major investment risk in the long run.
PLAYBOOK OF OPPORTUNITIES – HOW WE SEIZE THE CURRENT OPPORTUNITIES
Broad equity market level: we maintain our long-term optimistic bias, while looking forward to some volatility in the short term. The much-discussed recession might be shallow, but this less bad scenario is more than priced in in the market prices.
Economic sector level:
- Overweight cyclical sectors – technology, industrials, materials, consumer discretionary, energy and healthcare.
- Equal-weight –consumer staples, financials.
- Avoid - utilities, REITs.
More details on the sectors are available below in the section, Sector Positioning for Dividend Value Discipline TM.
SECTOR POSITIONING FOR THE DIVIDEND VALUE DISCIPLINETM
TECHNOLOGY SECTOR - Long-term positive. Short term caution.
- Assumptions: Sector to continue to grow above GDP level. Sector is now more mature/profitable vs. 20+ years ago, so we expect future cycles to be significantly less volatile compared to the dot-com bubble. Near-term tailwinds are coming from the AI race and push for semiconductor independence.
- Observations: High profit margins and cash flow generation. Low capital-intensity. Sells mostly productivity tools and solutions that are always in demand. After outperforming in 2014-2021, under-performed 2022 because of increasing interest rates and irrational capacity expansion during pandemic. Significantly outperformed the market in 2023, so some moderate underperformance is possible in the short term.
INDUSTRIAL SECTOR - Medium-term positive
- Assumptions: Sector might grow above GDP level in the medium term - driven by under-investment in infrastructure and in residential real estate; also, from the required investments for transitioning to green energy and onshoring of critical technologies.
- Observations: Industrial sector witnessed major tailwinds and relative out-performance until 2008, helped by growth of China and other emerging markets, as well as from the housing bubble in the U.S. Those tailwinds ended around 2008. The U.S. industrial sector underperformed significantly in 2018-2019 as several countries started rejecting globalism and embracing patriotism (e.g., U.S.-China trade wars), further deteriorated by lower capital investment during the pandemic. Global economic slowdown didn’t help in 2023, but we expect improvement in 2024.
CONSUMER DISCRETIONARY SECTOR - Medium-term positive
- Assumptions - we assume it is a good time to be overweight in the Consumer Discretionary sector, because: (1) peak recession fears are likely in the rear-view mirror now, (2) central banks are no longer tightening, (3) unemployment is very low.
- Observations: Consumer discretionary sector has very diverse and occasionally un-correlated holdings. This likely explains why it doesn’t have a clear long-term trend. U.S. consumer discretionary sector outperformed from 2000, underperformed from 2005, outperformed from 2009, underperformed from late 2021.
BASIC MATERIALS SECTOR - Long term positive
- Assumptions: Multiple strong tailwinds in several segments of materials sector, particularly for industrial metals, uranium, precious metals: (1) energy transition and climate concerns, (2) extreme underinvestment in capacity growth, (3) sector out of favour for too long, including due to climate impact.
- Observations: Sector is very diverse (industrial metals, precious metals, uranium, fertilizers and other chemicals). Sector underperformed after 2008-2009 as growth in emerging markets slowed down, further hit by trade wars, industrial recession, and pandemic. Sector performed in line with the board market since 2021.
ENERGY SECTOR - Medium term - mild positive
- Assumptions: We see pockets of opportunity within the Canadian and U.S. energy sector, based on following assumptions: (1) sector out of favour for too long. (2) sector is significantly more disciplined (focused on earnings and cash flow) compared to previous focus on growth-at-any-cost. (3) this discipline led to fewer exploration and capacity growth. (4) natural gas is cleaner than oil and coal. (5) transition to greener energy is requiring significant effort – including infrastructure, equipment and materials that require fossil fuels to be manufactured or Current oil prices are relatively low because the U.S. took various measures to increase the supply after the Russia Ukraine war started in early 2022. We expect those measures to wane after US elections.
- Observations: Last big round of outperformance of the energy sector was driven by record high oil and gas prices. These in turn were driven by rapid economic growth in emerging markets until 2008. The sector was hit by the great recession of 2008-2009, over-production of 2014, trade wars of 2018, and pandemic/shutdown 2020, and gradually increasing fight against fossil fuels. The sector outperformed the market in 2021-2022, and moderately underperformed in 2023. We assume global economic re-acceleration in 2024, which might support the energy sector.
HEALTHCARE SECTOR - Medium-term Neutral – Short term attractive.
- Assumptions: We expect the healthcare sector to perform in line with benchmarks, like it did since 2017. The favourable demographics (more old people in total population) is largely offset by an excessive (unaffordable) level of spending per capita, and recent promising results in diabetes/obesity medication space.
- Observations: The healthcare sector was outperforming significantly from 2011 until 2015. Large underperformance followed in late 2015 and 2016 because of uncertainties related to health care policies in the U.S. as the government was trying to slow the rapid rise of healthcare costs. Given large underperformance in 2023, we might witness some relative strength in this sector during 2024.
FINANCIAL SECTOR - Medium-term neutral.
- Assumptions: While the sector was struggling with old headwinds, a fresh major headwind hit the sector in 2023 (Silicon Valley Bank failure). We don’t expect major investment opportunities in the long term as the sector might face continued / increasing regulatory pressures on top of legacy headwinds.
- Observations: Sector suffered massive losses relative to the broad market during 2007-2008. Profitability affected by losses from mortgage-backed securities as well as increased regulation and low interest rates. Eroding competitive power as fintech companies are attracted by industry profits. We upgrade the financial sector from near-term “negative” to “neutral”, due to lower risks related to economic slowdown.
CONSUMER STAPLES SECTOR - Medium-term neutral.
- Assumptions: We see limited opportunity in participating in this sector: (1) companies often have slow growth and difficulties in expanding their profit margins; (2) everybody is expecting / discussing recession risk for ~2 consecutive years – a good time to stay away from defensive sectors like this.
- Observations: The 20-year return of the consumer staples sector is very similar to broad market indexes. It usually outperforms the market in a recessionary environment; however, those periods are relatively short. Given large underperformance in 2023, we might witness some relative strength in this sector during 2024 - because of this we are upgrading the sector from medium-term “negative” to “neutral”.
COMMUNICATIONS SECTOR - Avoid (limited options)
- Assumptions: We see little opportunity in participating in this sector. (1) Legacy communication companies are slow growth or no growth, as their moat is eroding. (2) New generation of companies don’t meet our dividend requirements. Even if they paid dividends, they are mostly mega-cap companies followed by dozens of analysts and investors - i.e., a very crowded space.
- Observations: Sector witnessed significant outperformance after 2008, led by a new generation of communication services companies (Google, Facebook, Netflix, etc). Significant underperformance followed in late 2021 and 2022, due to the same holdings, as it happened with the technology sector. In 2023, the sector recovered half of the relative losses from 2021-2022.
UTILITIES & REAL ESTATE (REIT) SECTORS - Avoid (too small and complicated)
- Assumptions: While we occasionally have short term exposure to these sectors in other strategies, we largely avoid them in our core strategy, The Dividend Value DisciplineTM
- Observations: (1) Weak performance due to slow growth, (2) Complex, heavily regulated sectors, (3) Huge sensitivity to interest rates, (4) Clients presumably already have significant exposure to residential and commercial real estate.
The information contained in this report was obtained from sources believed to be reliable, however, we cannot represent that it is accurate or complete and it should not be considered personal tax advice. This report is provided as a general source of information and should not be considered personal investment advice or solicitation to buy or sell securities. The views expressed are those of the author and not necessarily those of Raymond James. We are not tax advisors and we recommend that clients seek independent advice from a professional advisor on tax-related matters. This provides links to other Internet sites for the convenience of users. Raymond James Ltd./Raymond James (USA) Ltd is not responsible for the availability or content of these external sites, nor does Raymond James Ltd/Raymond James (USA) Ltd endorse, warrant or guarantee the products, services or information described or offered at these other Internet sites. Users cannot assume that the external sites will abide by the same Privacy Policy which Raymond James Ltd/Raymond James (USA) Ltd adheres to. Raymond James Ltd., Member—Canadian Investor Protection Fund. Raymond James (USA) Ltd. (RJLU) advisors may only conduct business with residents of the states and/or jurisdictions for which they are properly registered. Raymond James (USA) Ltd. is a member of FINRA/SIPC.


![]()
